Occupancy Grids
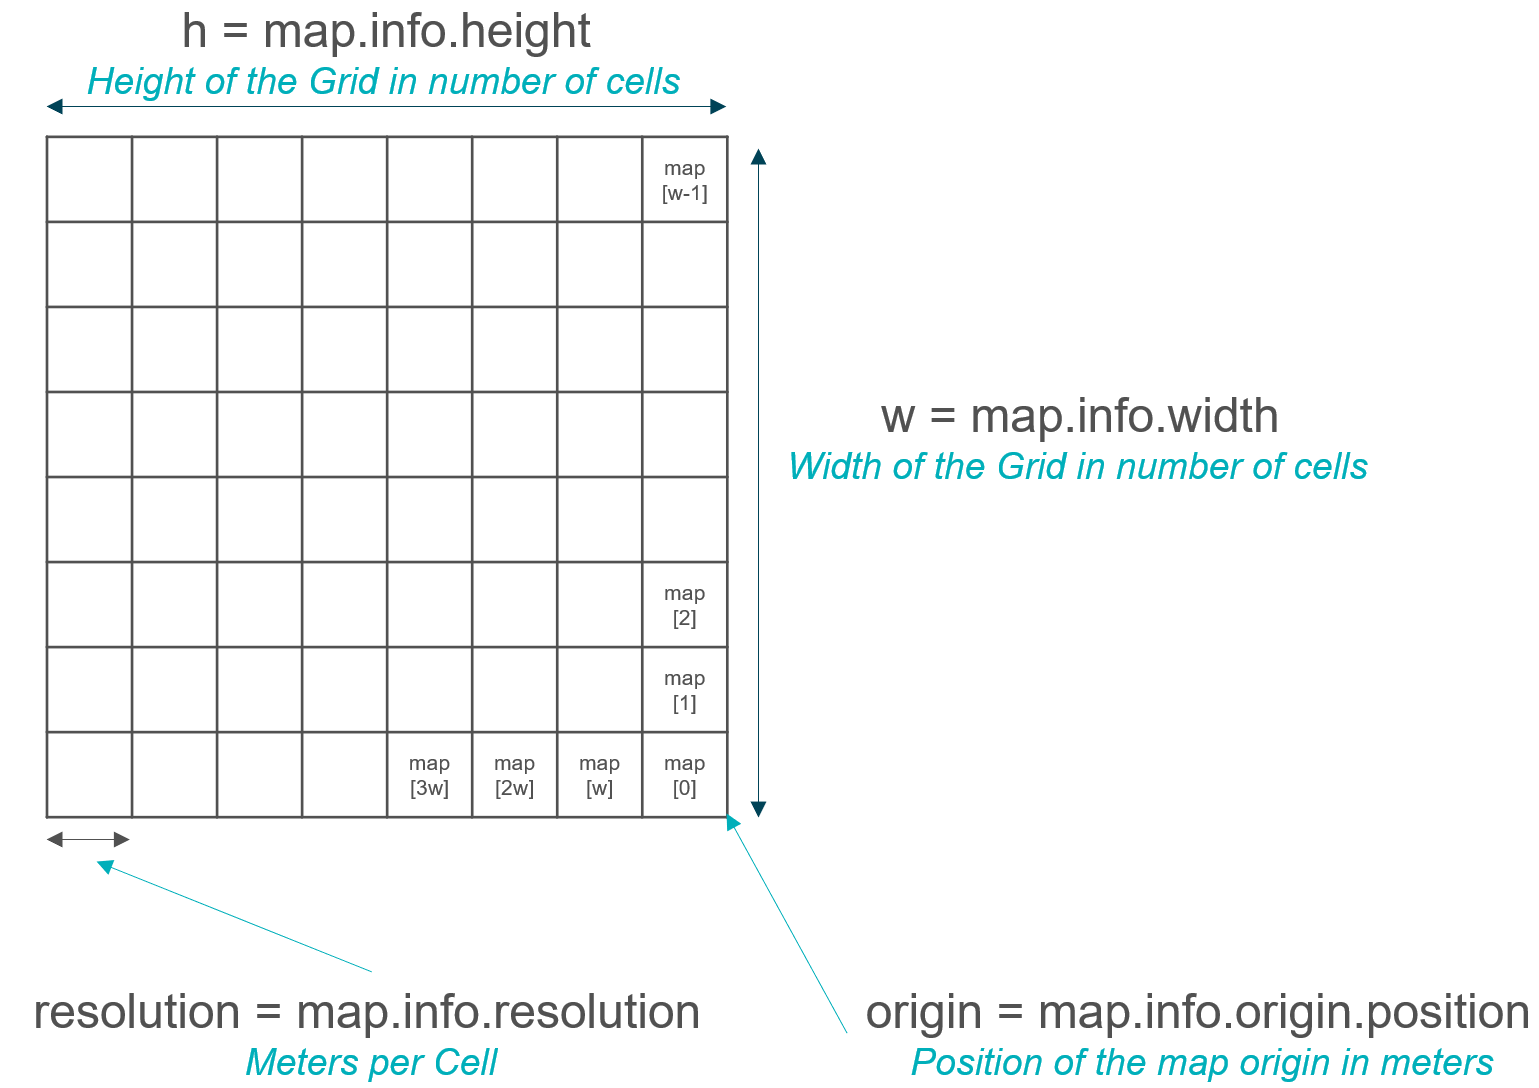
In ROS, Occupancy Grid is a data type which represents a 2 dimensional grid map in which each cell gives the probability of an obstacle being at that position. Normally this type of map is produced with a robot moving through an environment and mapping it using a SLAM algorithm. The Occupancy grid data is given in a 1 dimensional array in row-major order starting at the bottom right corner of the map. The data values have the following meaning:
- -1 = unknown
- 0-100 = probability of occupancy. Which means 0 is definitely no obstacle and 100 is definitely an obstacle.
The Occupancy Grids also carry other useful meta data:
Useful helper functions
This section gives you a view useful code-snippets that you might want to use during your semester project. It is expected that you use the code in a class environment.
Subscribing to the map topic
To subscribe to the map topic, use the following code. The qos_profile (Quality of Service) allows you to more finely tune the communication in ROS2. It is out of the scope of this course to explain what it does in detail but if you are interested you can read more here.
from rclpy.qos import QoSProfile, QoSReliabilityPolicy, QoSHistoryPolicy, QoSDurabilityPolicy
from nav_msgs.msg import OccupancyGrid

qos_profile = QoSProfile(reliability=QoSReliabilityPolicy.RMW_QOS_POLICY_RELIABILITY_RELIABLE,
                        history=QoSHistoryPolicy.RMW_QOS_POLICY_HISTORY_KEEP_LAST,
                        durability=QoSDurabilityPolicy.RMW_QOS_POLICY_DURABILITY_TRANSIENT_LOCAL,
                        depth=5,
)

self.create_subscription(OccupancyGrid, '/map', callback=self.clbk_map, qos_profile=qos_profile)
Translate map list integer into a x and y map coordinates
def get_map_pos(self, map_iter):
    x = int(map_iter/self.map_msg.info.width)
    y = int(map_iter - x*self.map_msg.info.width)

    return [x, y]
Translate map coordinates into world position coordinates in meters
def get_world_pos(self, x, y):
    map_position = Point()
    map_position.x = self.map_msg.info.origin.position.x + y*self.map_msg.info.resolution
    map_position.y = self.map_msg.info.origin.position.y + x*self.map_msg.info.resolution

    return map_position
Translate x and y map coordinates into the corresponding map list integer value
def get_map_iter(self, x, y):
    map_iter = x*self.map_msg_og.info.width + y

    return map_iter
Visualization through RViz Markers
The Markers display allows programmatic addition of various primitive shapes to the 3D view by sending a visualization_msgs/Marker or visualization_msgs/MarkerArray message.
Example Code
Here is an example code written in python on how to visualize 2 points within rviz using the Marker type:
import rclpy
from rclpy.node import Node
from geometry_msgs.msg import Point
from visualization_msgs.msg import Marker

class MapMarkerClass(Node):
    def __init__(self):
        super().__init__('MapMarkerNode')

        self.pub_marker = self.create_publisher(Marker, 'marker_visual', 2)

        self.marker_msg = Marker()
        #Defines the transformation frame with which the following data is associated
        self.marker_msg.header.frame_id = "/map"
        #Defines the current time in ros time
        self.marker_msg.header.stamp = self.get_clock().now().to_msg()
        #Assign a unique marker id
        self.marker_msg.id = 0
        #Define the type of oject that is displayed
        self.marker_msg.type = Marker.POINTS
        #Define the action that is taken
        self.marker_msg.action = Marker.ADD
        #Define part of the orientation of the object displayed in rviz
        self.marker_msg.pose.orientation.w =1.0
        # Defines the size of the marker (in meters) displayed in rviz
        self.marker_msg.scale.x=0.1
        self.marker_msg.scale.y=0.1
        # Define the color (red, green and blue from 0-1) and the opacity (alpha from 0-1)
        self.marker_msg.color.r = 0.0/255.0
        self.marker_msg.color.g = 255.0/255.0
        self.marker_msg.color.b = 0.0/255.0
        self.marker_msg.color.a = 1.0
        #Define how long the object should last before being automatically deleted, where 0 indicates forever
        self.marker_msg.lifetime = rclpy.duration.Duration().to_msg()

        timer_period = 1.0  # seconds
        self.timer = self.create_timer(timer_period, self.timer_callback)

    def timer_callback(self):
        #Position of point 1
        point_1 = Point()
        point_1.x = 1.5
        point_1.y = -2.5

        #Position of point 2
        point_2 = Point()
        point_2.x = -4.0
        point_2.y = 6.0

        #Add Points to the Marker message
        self.marker_msg.points = [point_1, point_2]
        #Publish Marker message
        self.pub_marker.publish(self.marker_msg)

def main(args=None):
    rclpy.init(args=args)

    map_marker = MapMarkerClass()

    rclpy.spin(map_marker)

    map_marker.destroy_node()
    rclpy.shutdown()


if __name__ == '__main__':
    main()
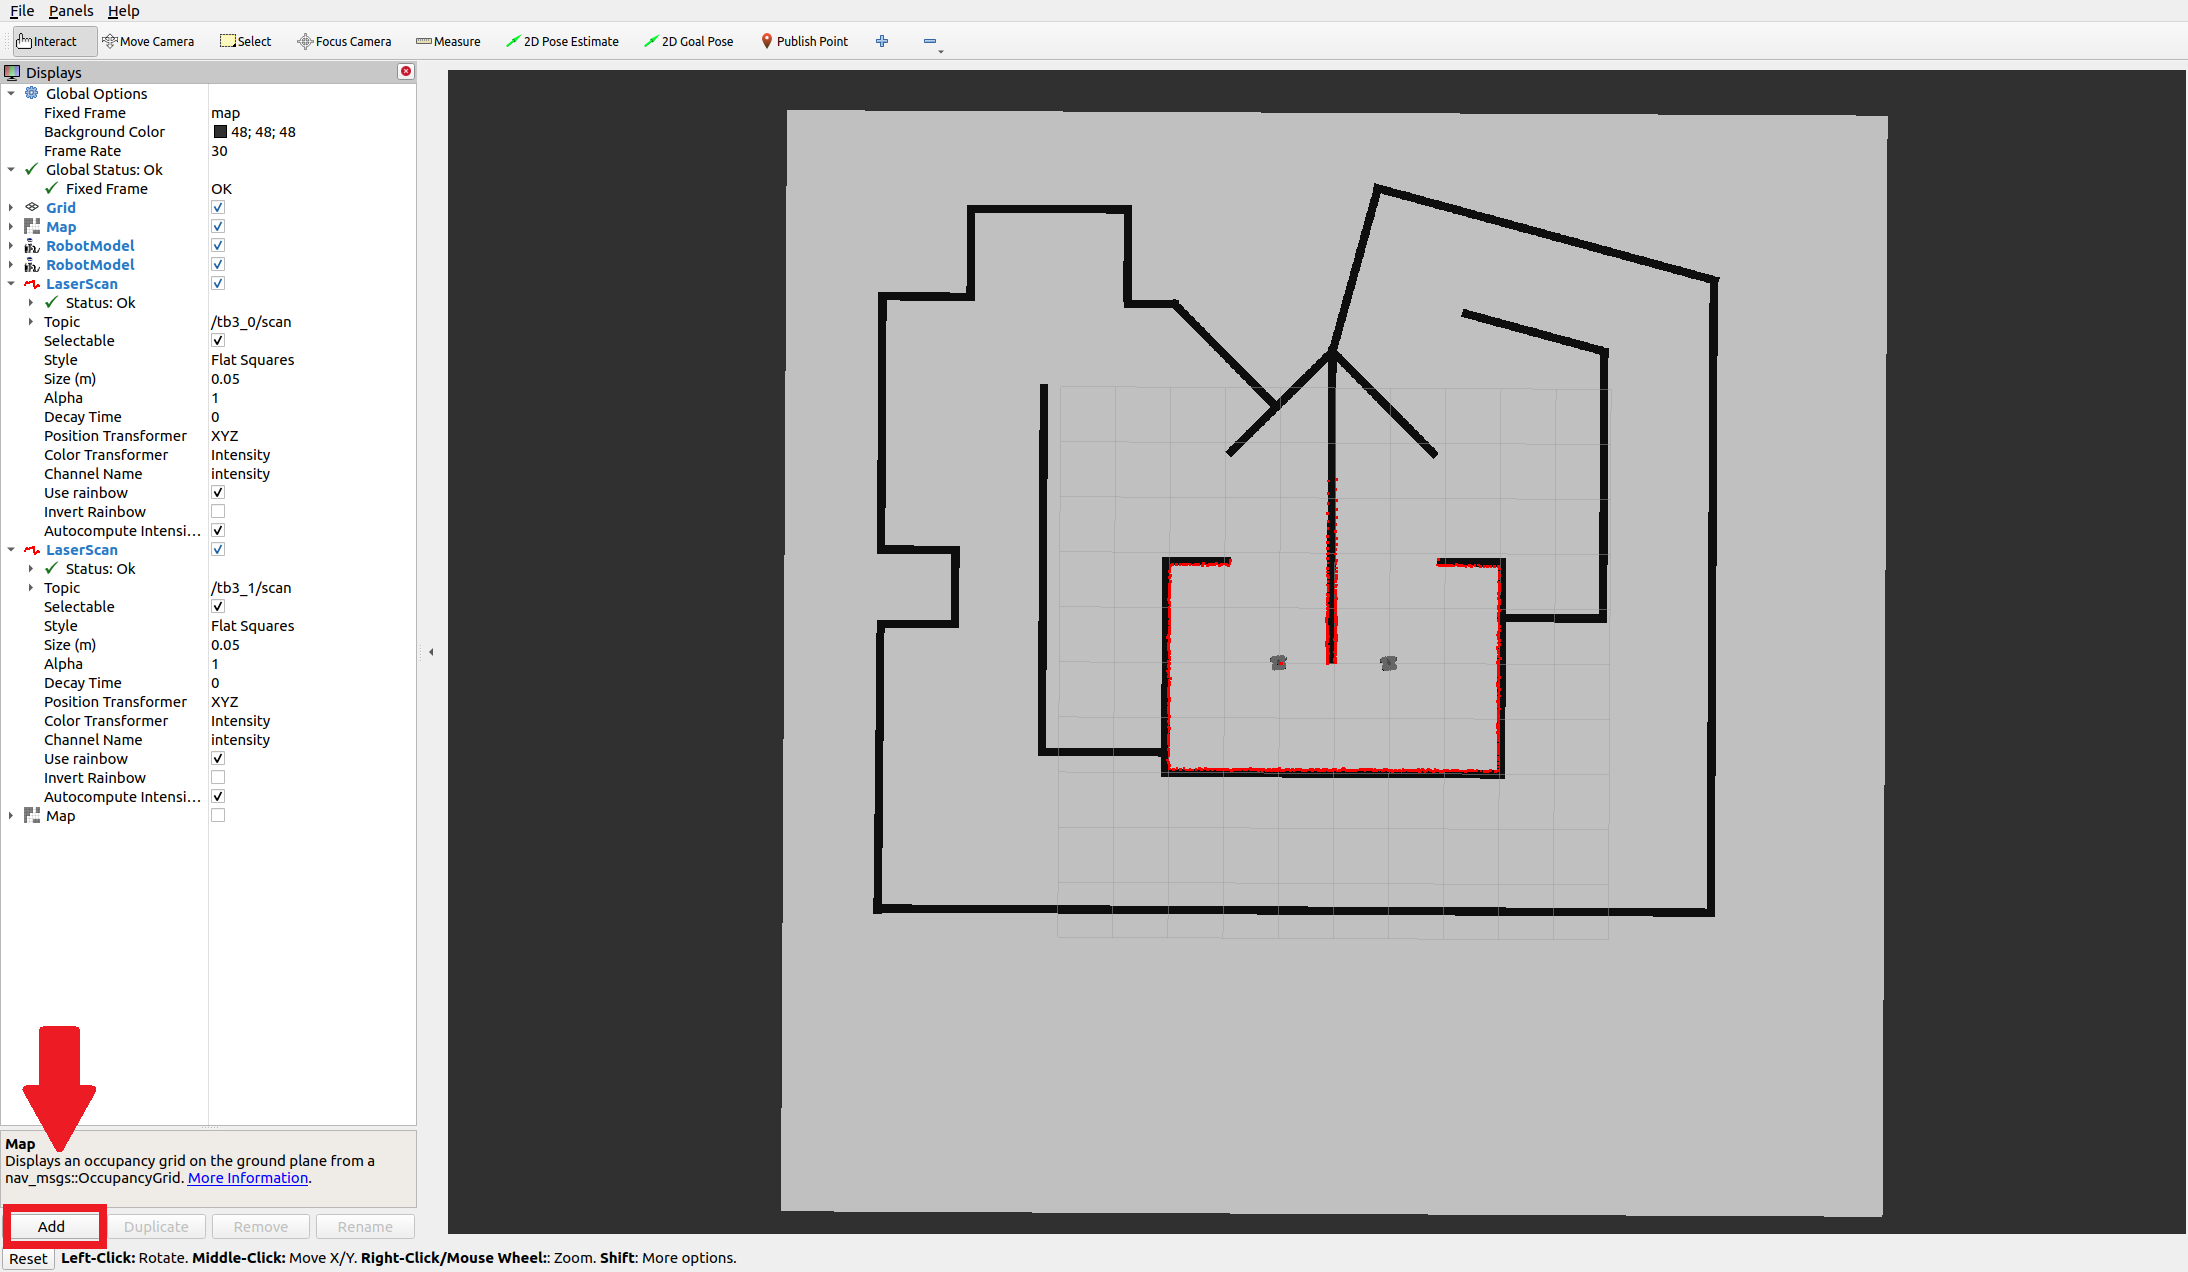
Setup in RViz
In rviz press the Add button to add a new display object:
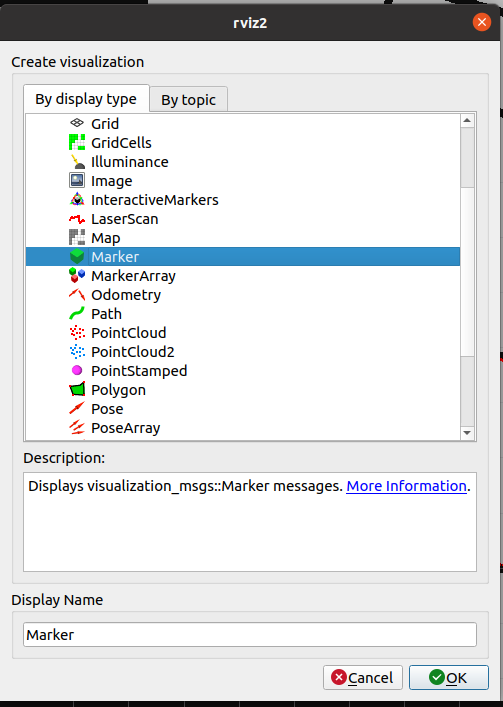
Select Marker as the type and press okay:
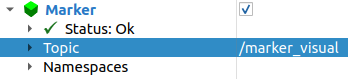
Remember to change the topic name to which the object is subscribing to:
Exercise
Create an algorithm that finds a bounding box around the outer walls of the map and draws the corners of the bounding box in rviz. To find the bounding box find the following values:
- the minimum and maximum positions of a wall on the x-axis
- the minimum and maximum position of a wall on the y-axis
Then draw the following position combinations:
- x_min, y_min
- x_min, y_max
- x_max, y_min
- x_max, y_max
Inside the given ROS package multi_robot_challenge_23 do the following steps:
- In the ros2_students_25/occupancy_grid_exercise repository you will find the following file:
map_filter.py. Copy it to ros2_ws/src/multi_robot_challenge_23/multi_robot_challenge_23. - Make sure that
map_filter.pyis configured as a console script insetup.pysimilar to what you have done to set up thebraitenberg_vehicleassignment. - Complete the exercise by following the TODOs in the
map_filter.pyscript. - To test your solution do the following steps:
- Launch one of the semester project maps. E.g.
ros2 launch multi_robot_challenge_23 rescue_robots_w1.launch.py. - Run the marker detection script. E.g.
ros2 run multi_robot_challenge_23 map_filter. - Check in rviz if you can see 4 green points.
Note: In order to see the green points you need to do the setup described in the previous section (Setup in RViz).
- Launch one of the semester project maps. E.g.